About
Blog
Contact
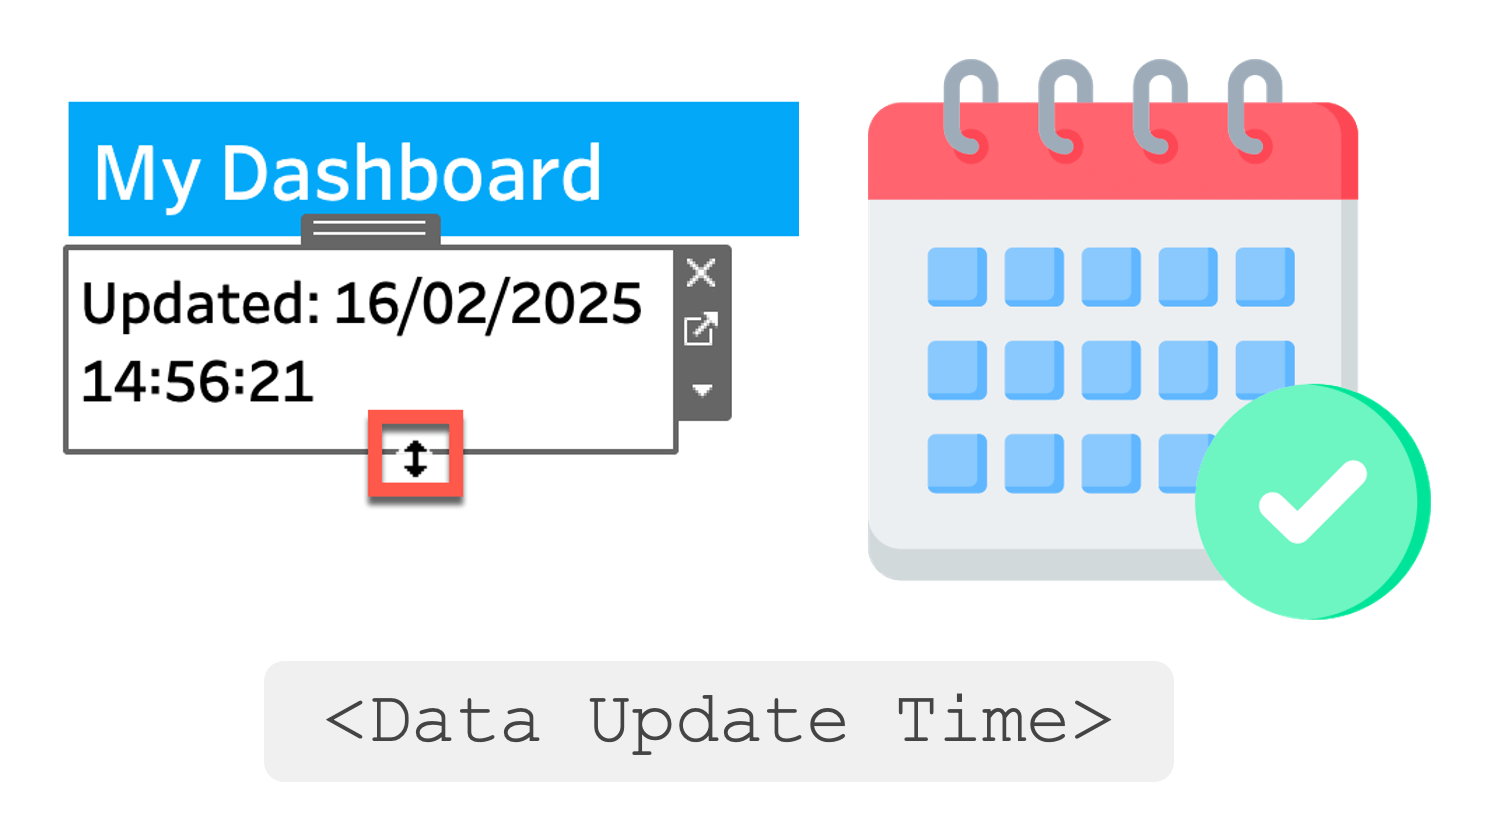
How to add the last refresh date to your Tableau dashboard
A simple 3-step guide to adding the most recent data refresh date to your dashboard.
#Tableau
#HowTo
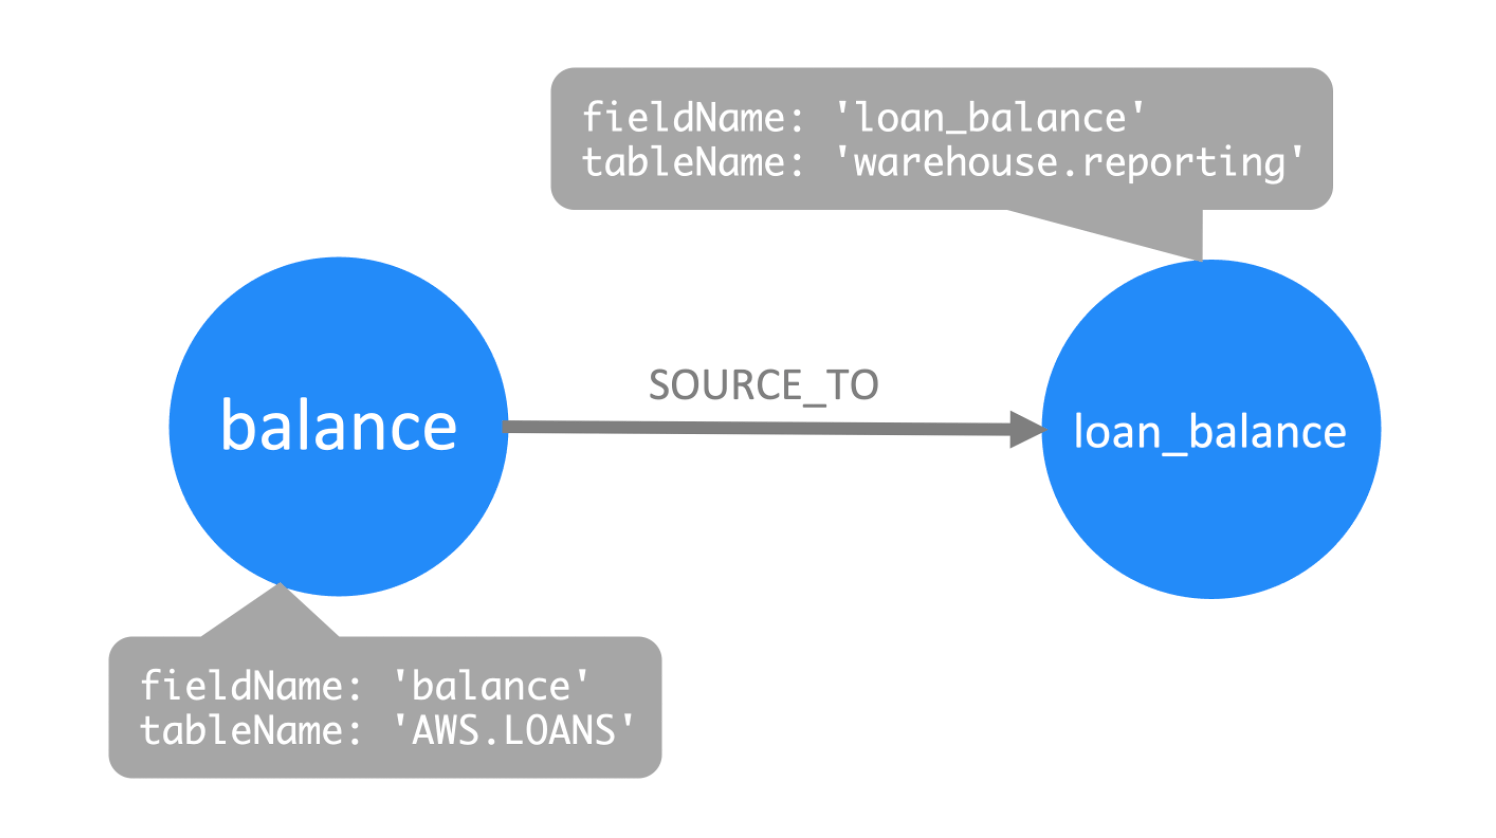
Benefits of using a graph database to map data lineage
Data lineage can be represented using graph database nodes and relationships.
#SQL
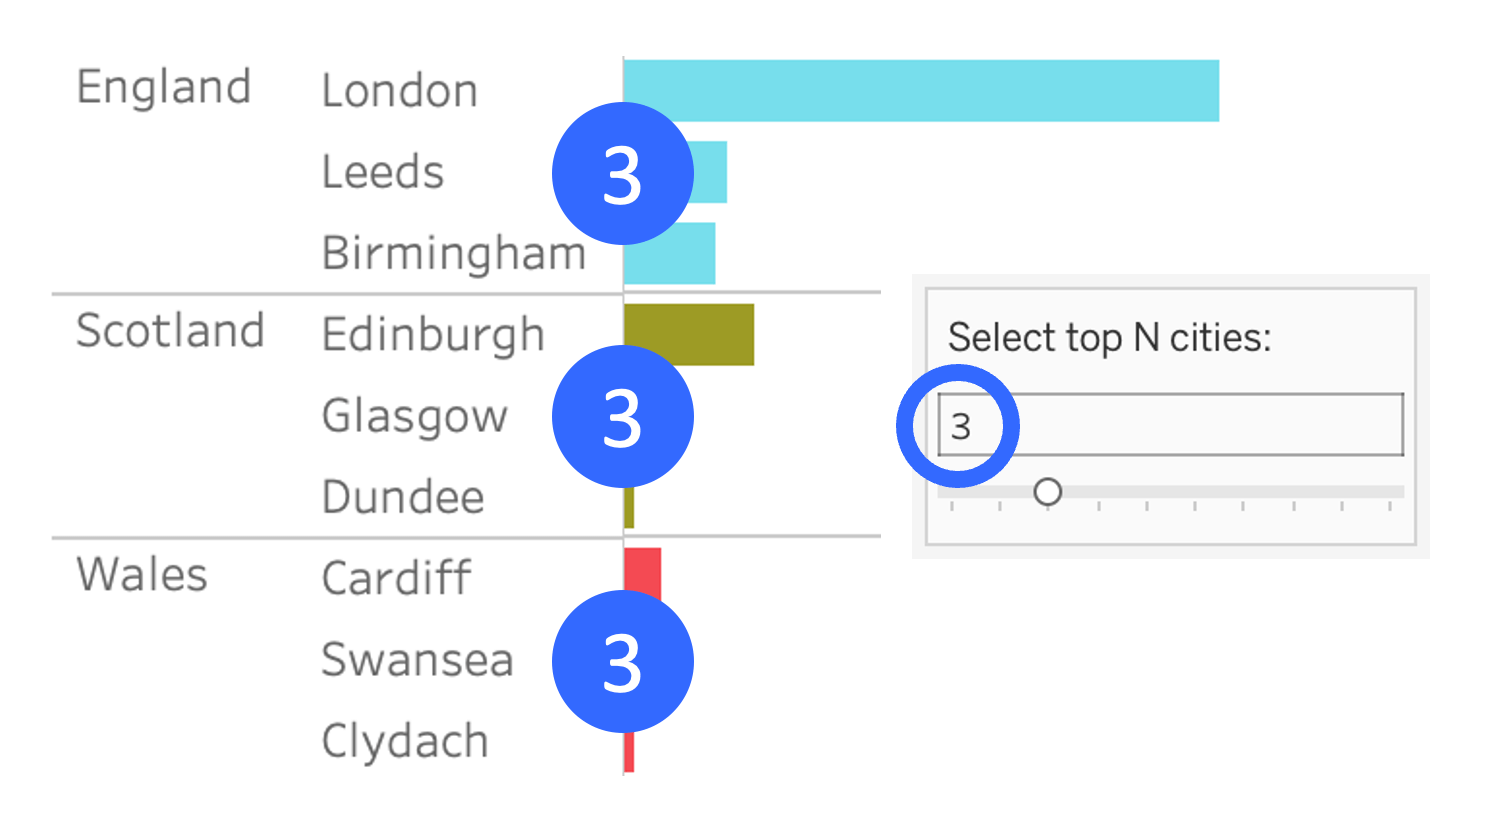
How to filter the top N values per category in Tableau
A guide to filtering the top sub-category values per category.
#Tableau
#HowTo
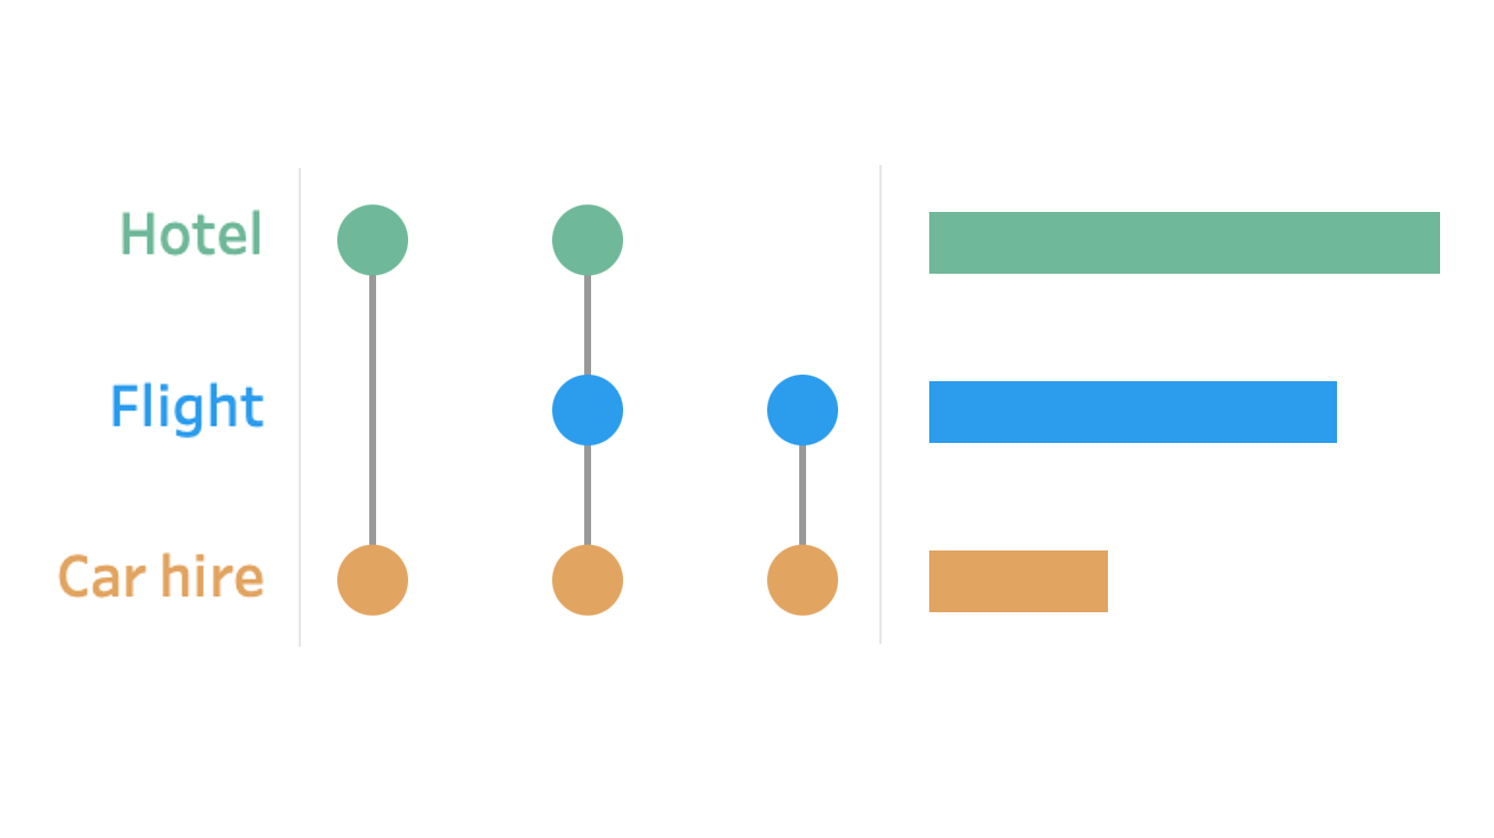
Using an UpSet plot to show business mix
UpSet plots are useful for showing the intersection between sets.
#Tableau
#SWDchallenge
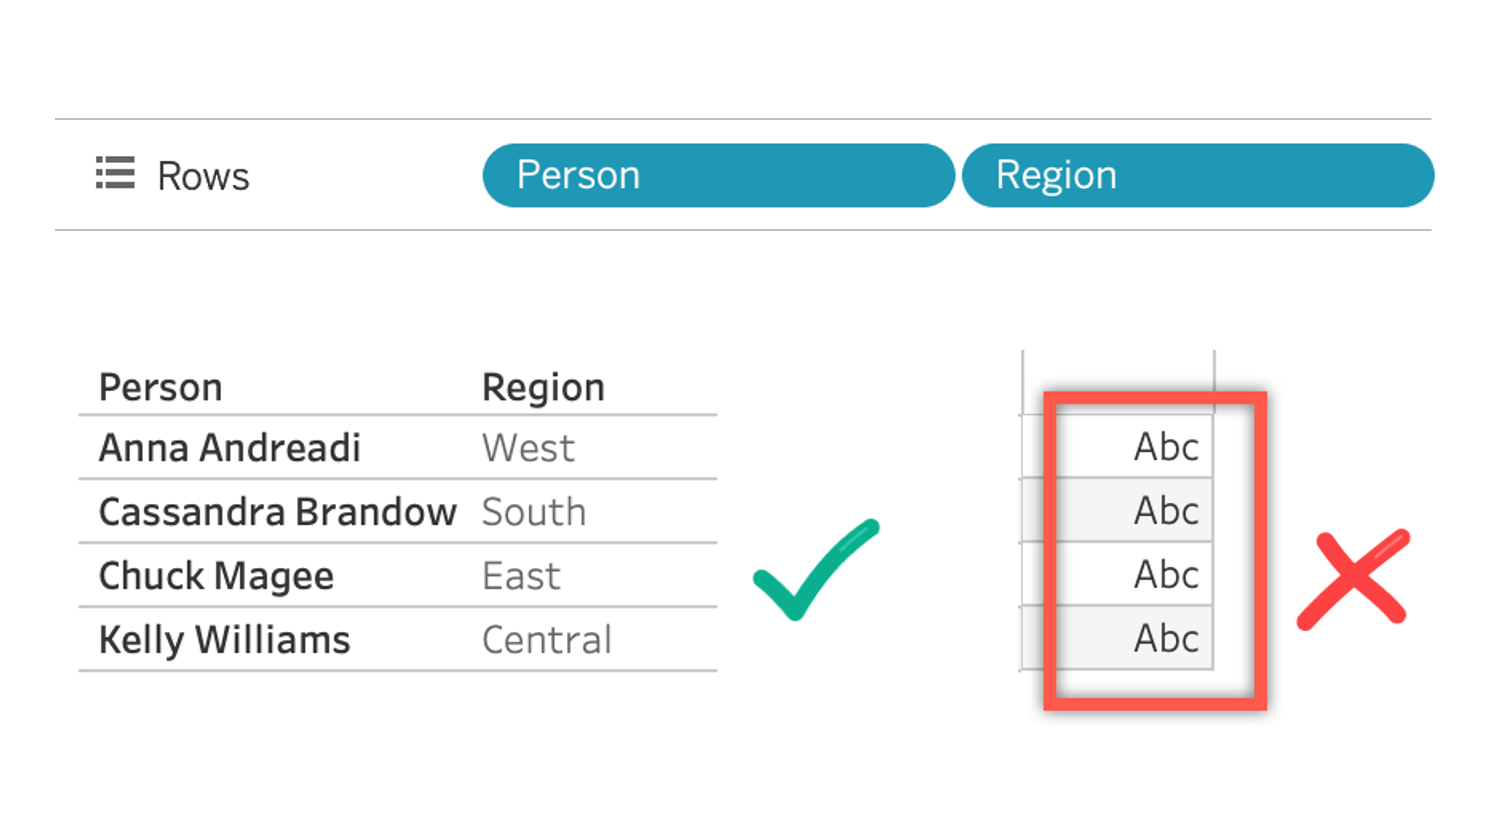
How to make a table with only dimensions in Tableau
Step-by-step instructions for removing the default 'Abc' placeholder from the pane.
#Tableau
#HowTo
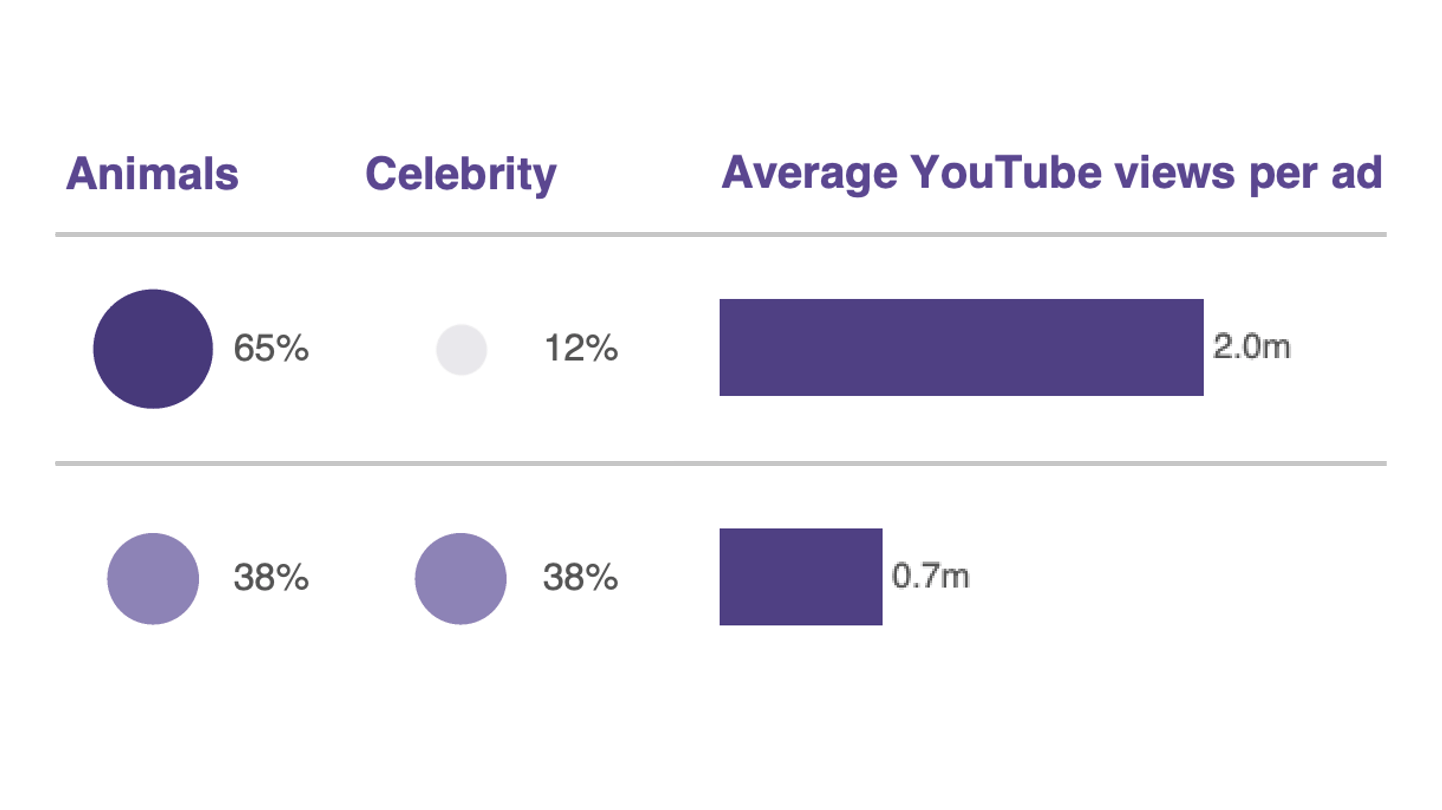
What makes a popular Super Bowl commercial?
Exploring the blend of attributes top brands use in their ads.
#SWDchallenge
#Tableau
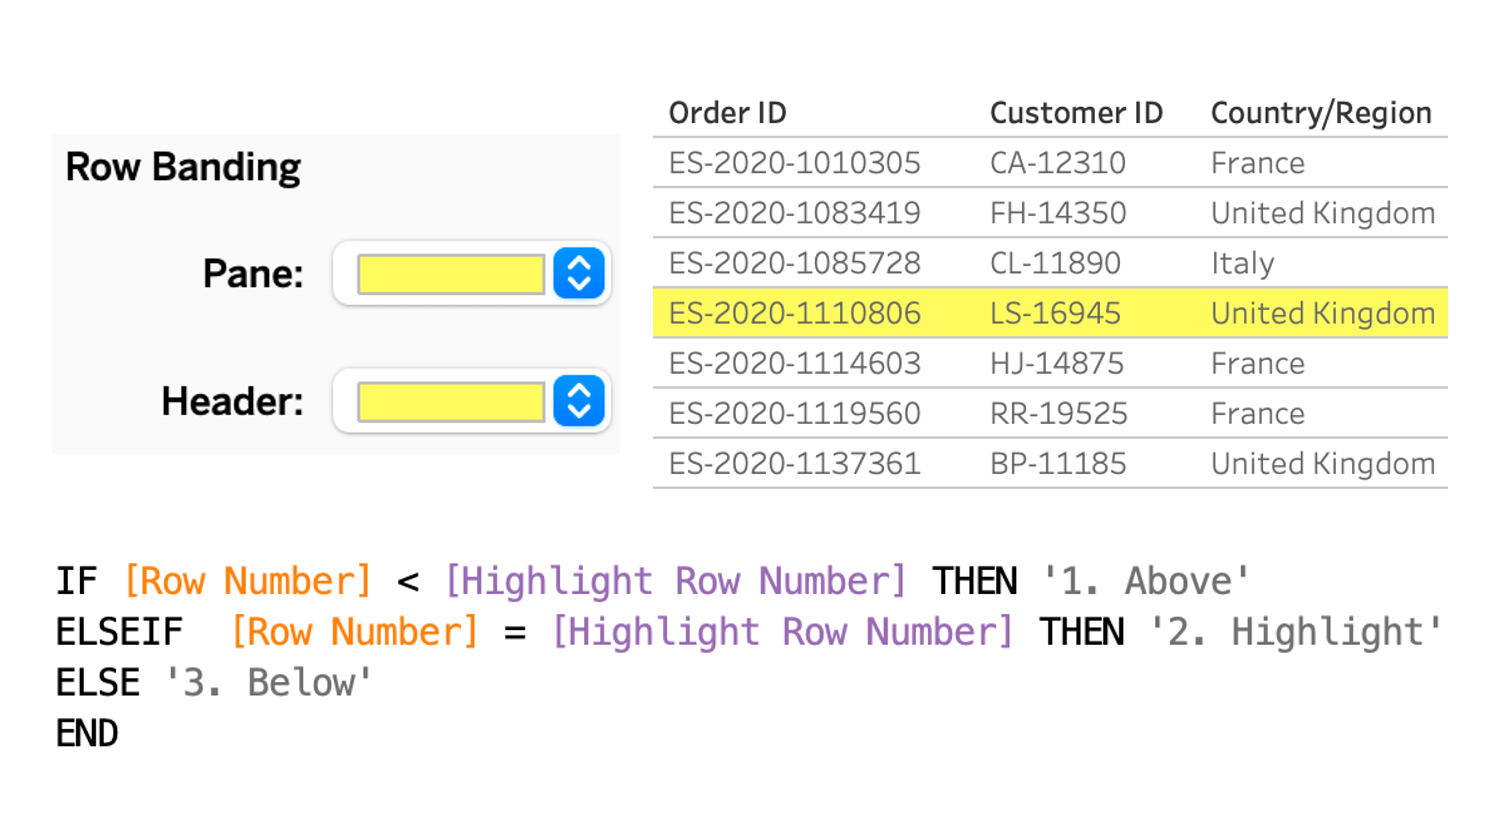
How to highlight an entire row in a Tableau table
Help users keep track of what they’re looking at as they scroll horizontally.
#Tableau
#HowTo
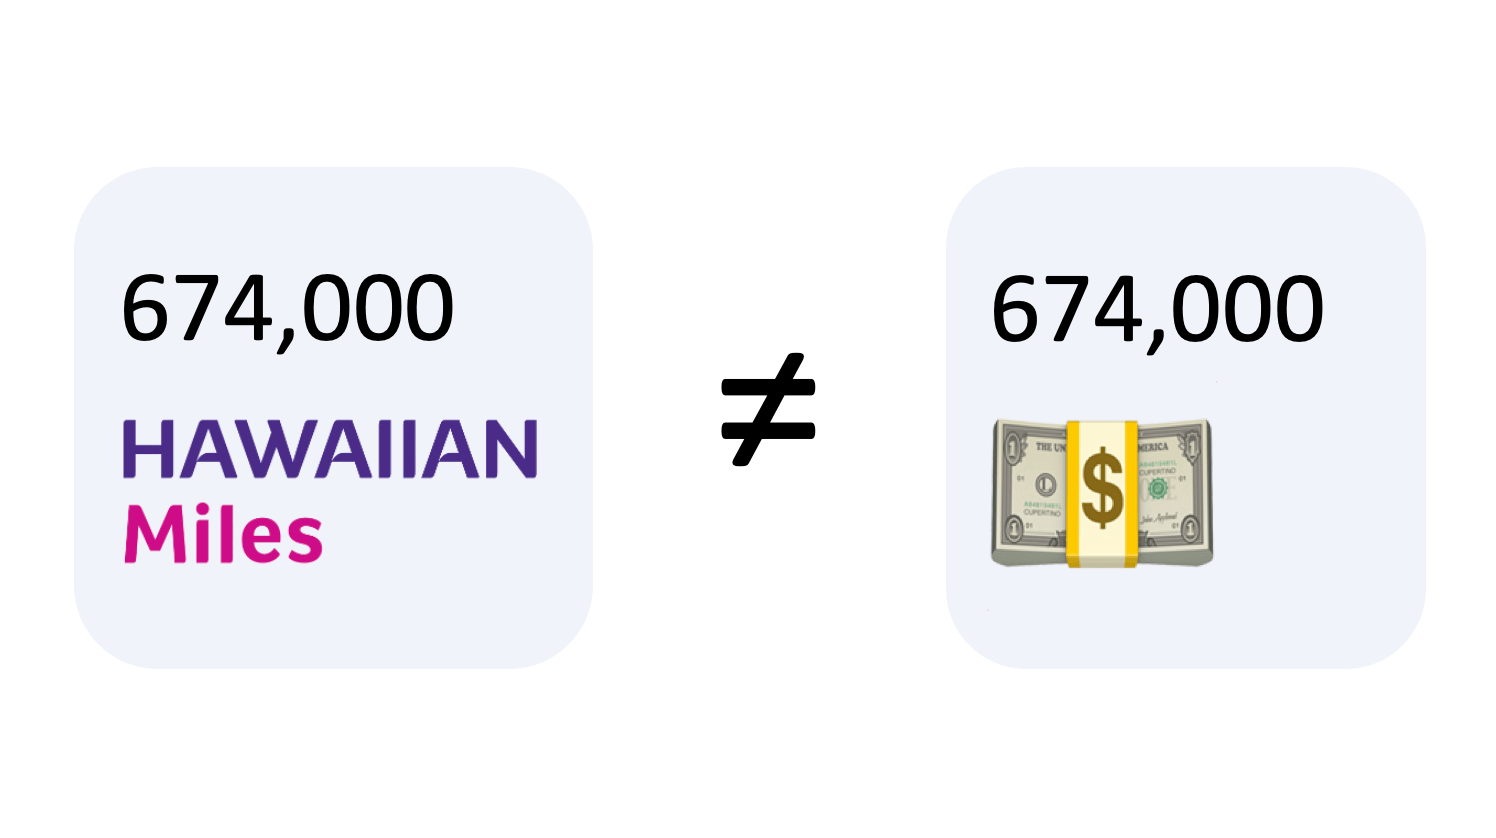
How bad data quality is losing your business money every day
From miscalculations to missed opportunities, bad data quality can be expensive.
#DataQuality
3 things I learned by taking the Tableau exam
Improve your understanding of Tableau by studying for the certification exam.
#Tableau
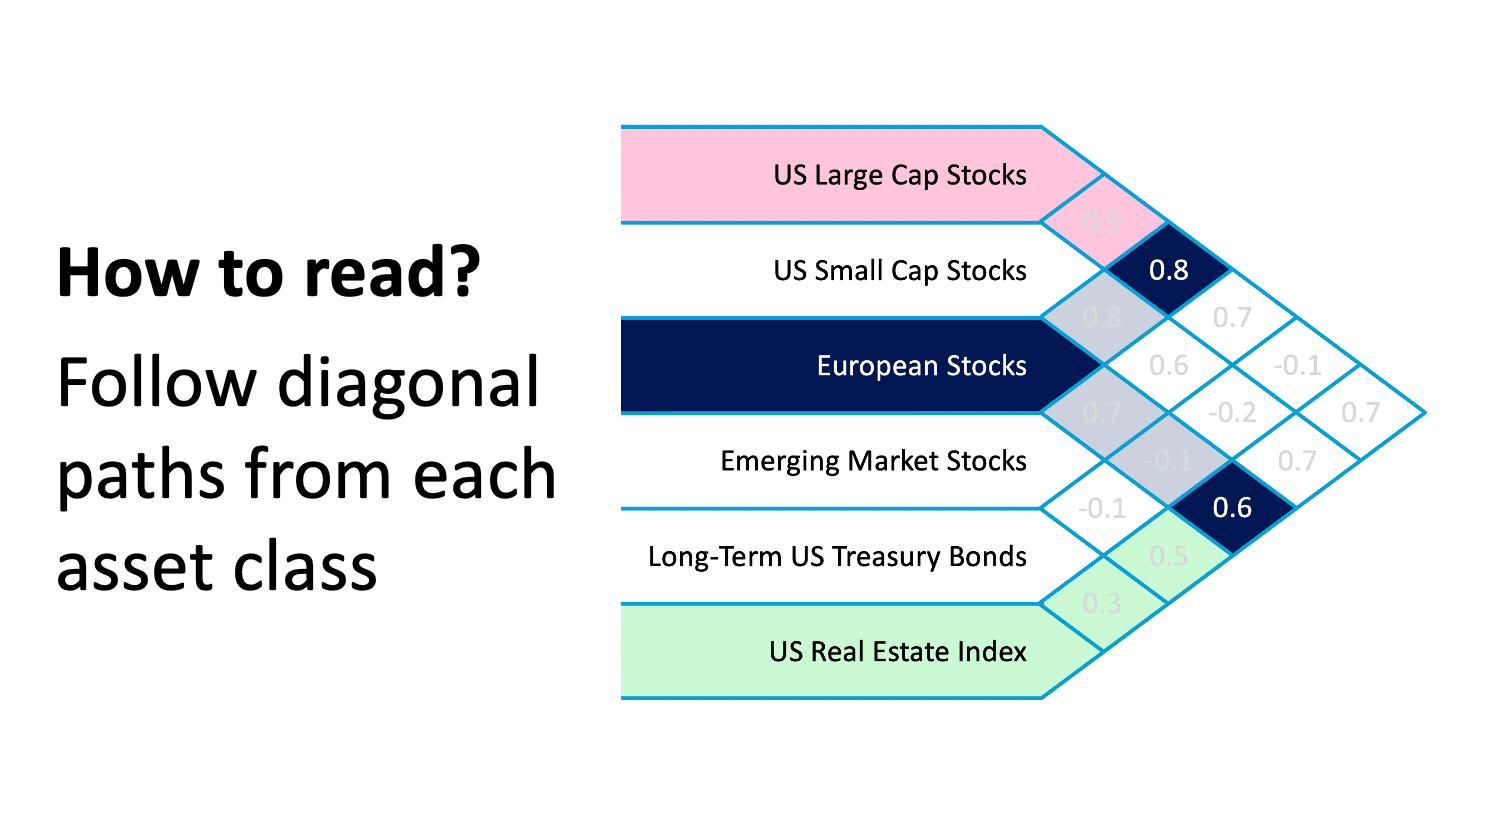
A different way to show correlations
The roof-shaped matrix is a great alternative to a standard correlation matrix.
#SWDchallenge
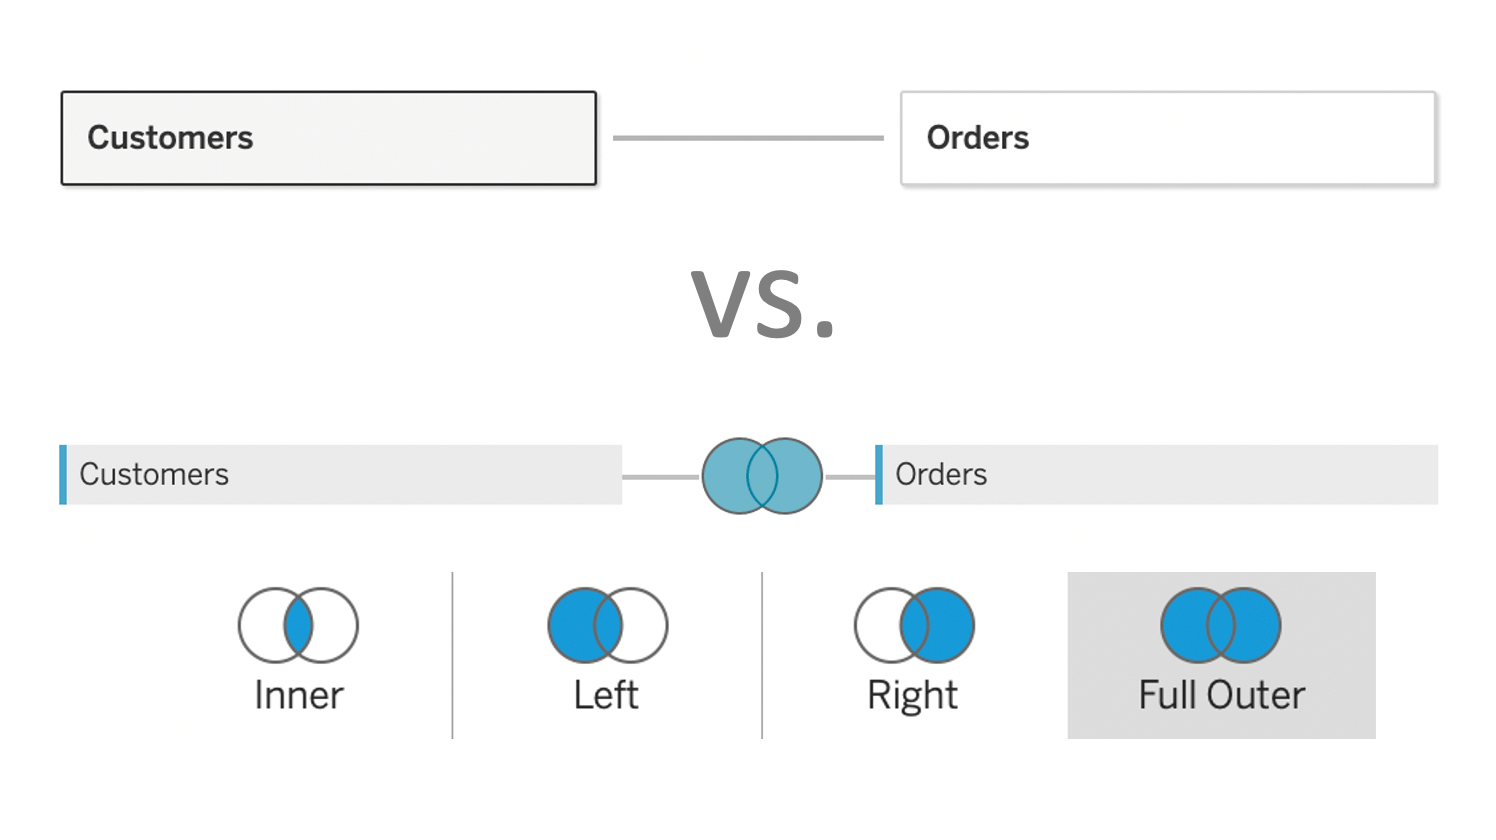
Data relationships vs. data joins in Tableau
Find out which problem data relationships solve, and why they’re so useful.
#Tableau
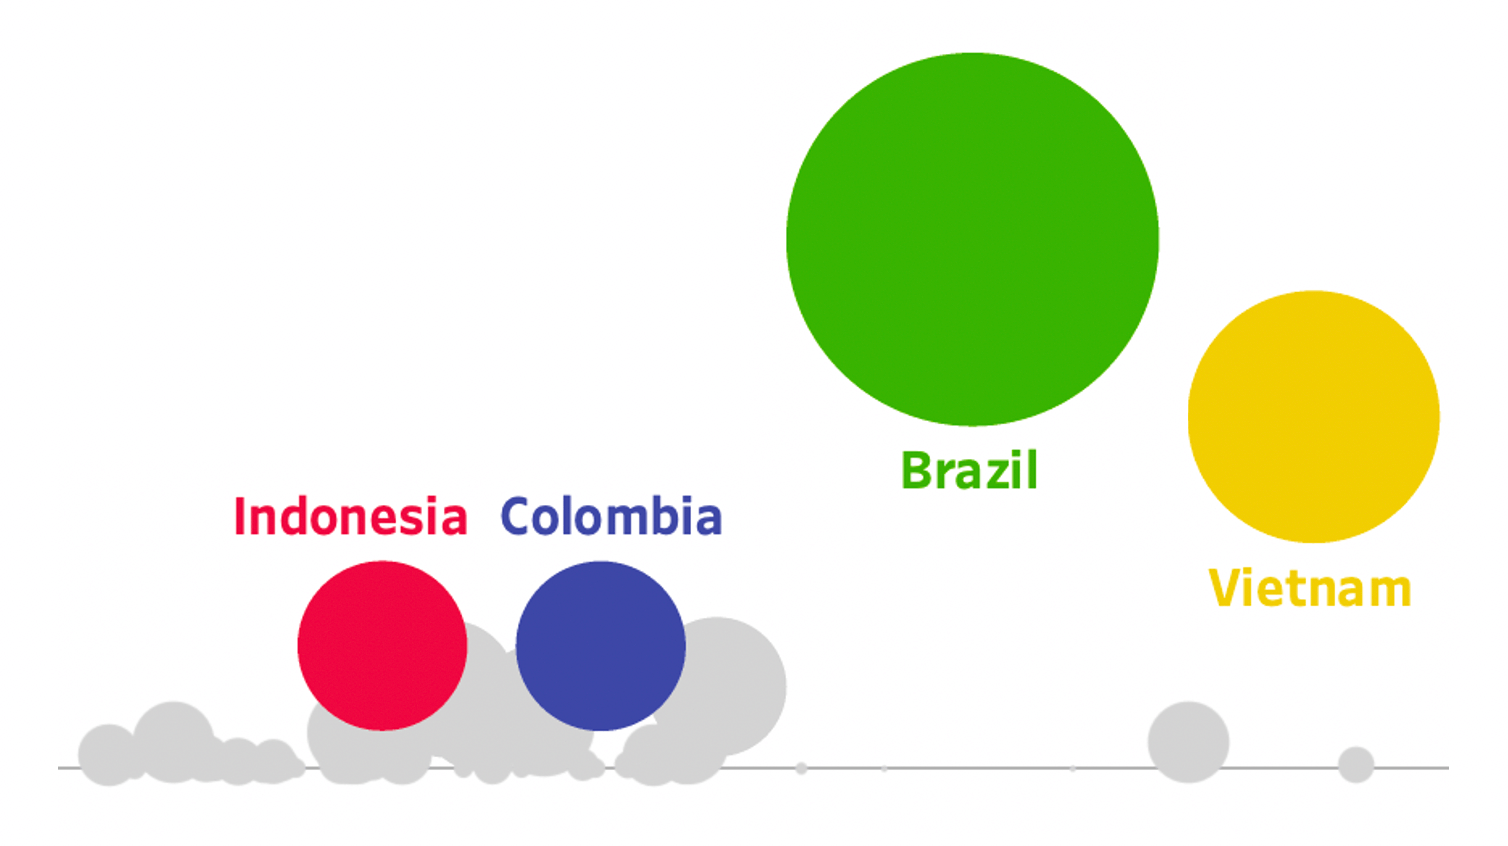
Global coffee production and crop yields
Explore how coffee production has changed over the last six decades.
#Tableau
#SWDchallenge
««
«
1
2
3
»
»»