About
Blog
Contact
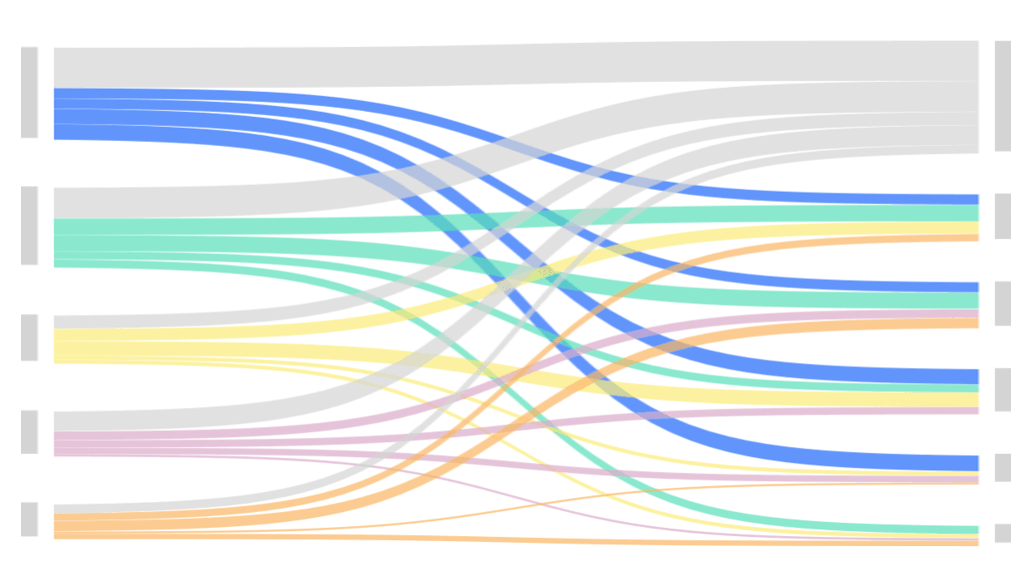
Which Marketing Channels Do Customers Use Before Buying?
Visualize the customer journey using a Sankey Diagram
#SWDchallenge
#Tableau
How to Explode Arrays with Presto
Find out how to give each element of an array its own row
#SQL
#HowTo
How to Join DataFrames with PySpark
Learn how to use the join() DataFrame method
#Python
#HowTo
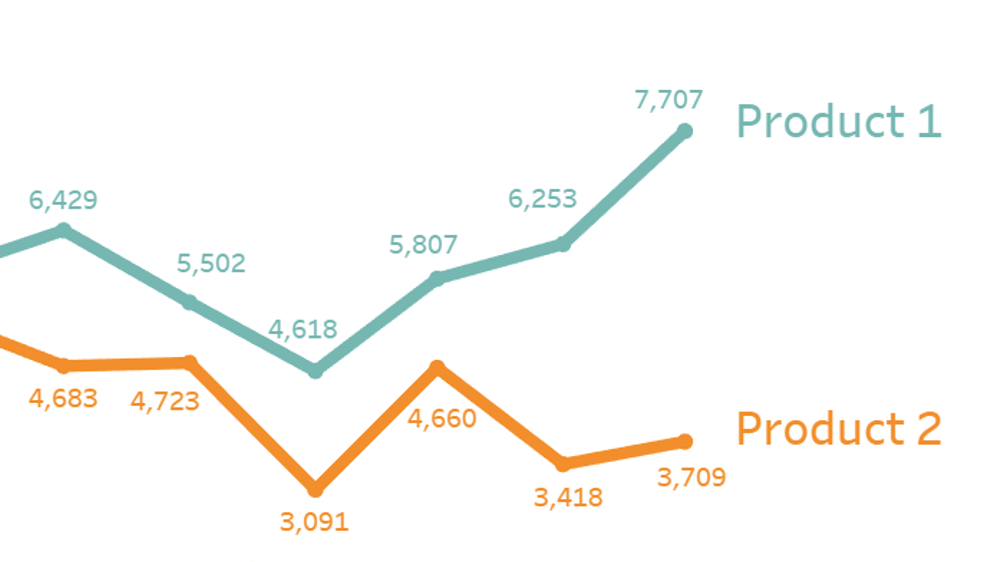
Tableau Data Blending Saved Me Two Days' Work!
Using a data blend to add metrics to your dashboard
#Tableau
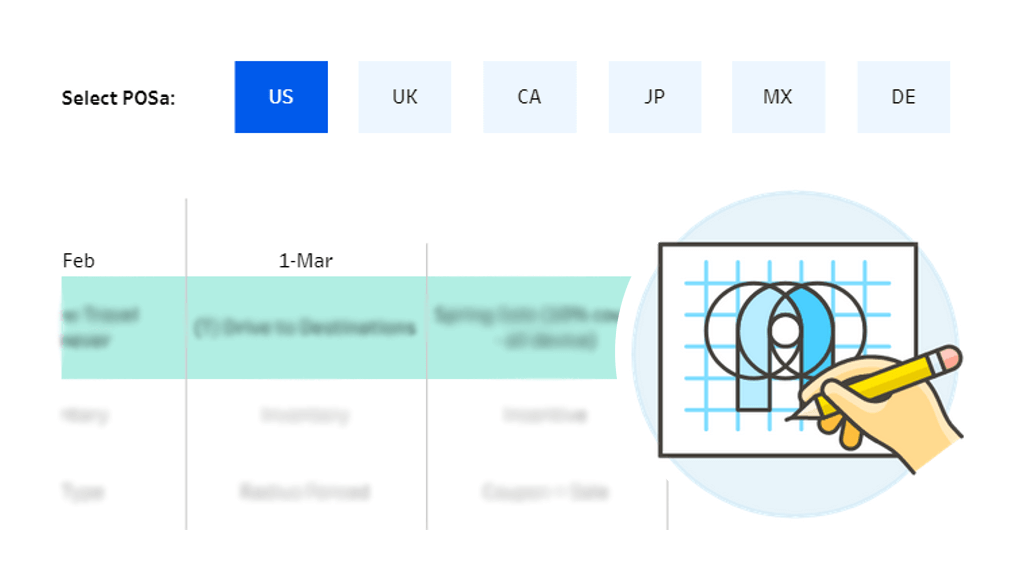
Sketch Before You Build
Going back to basics with this month's SWD challenge
#SWDchallenge
#Tableau
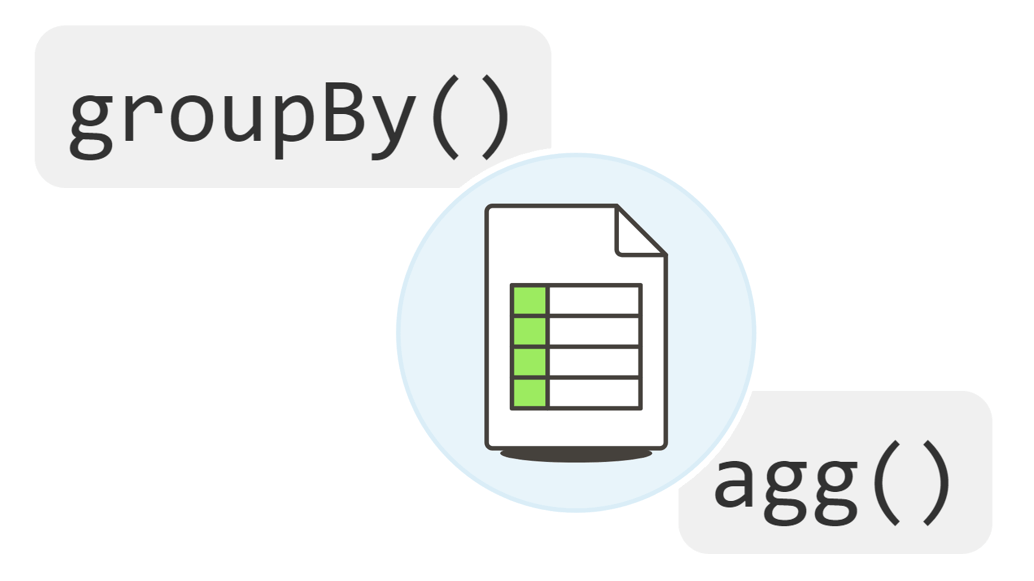
How to Aggregate Data with PySpark
Learn how to group your data and create summaries in PySpark
#Python
#HowTo
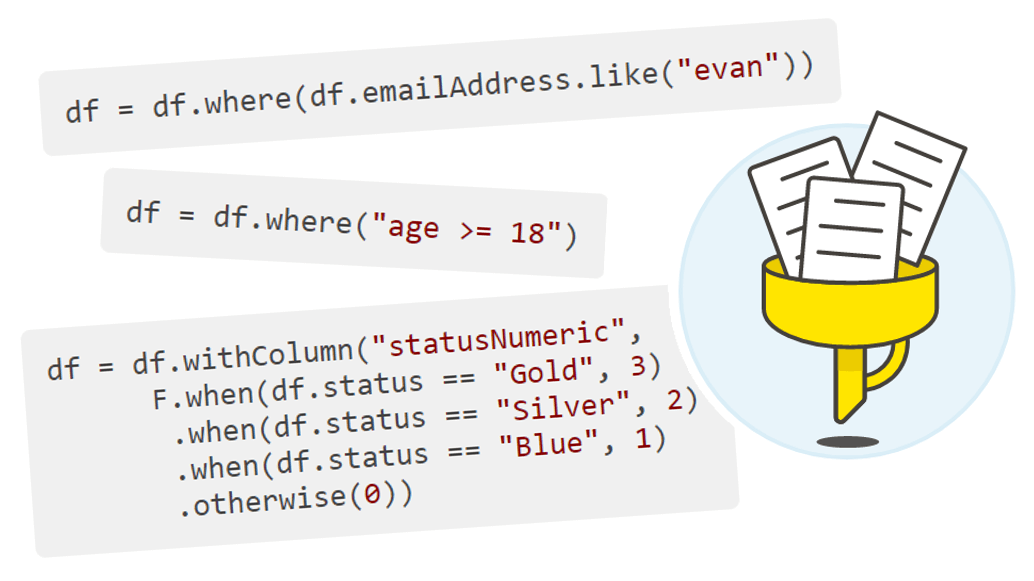
How to Query Data with PySpark
Learn the basics of selecting columns as well as filtering rows
#Python
#HowTo
What is PySpark and Why Should I Use It?
An overview of how PySpark works and how it could help you
#Python
How to Label Measure Values and Names in Tableau
A step-by-step guide to labelling your measures
#HowTo
#Tableau
How to Make Label Colours Dynamic in Tableau
A guide to updating label colours based on their values
#Tableau
#HowTo
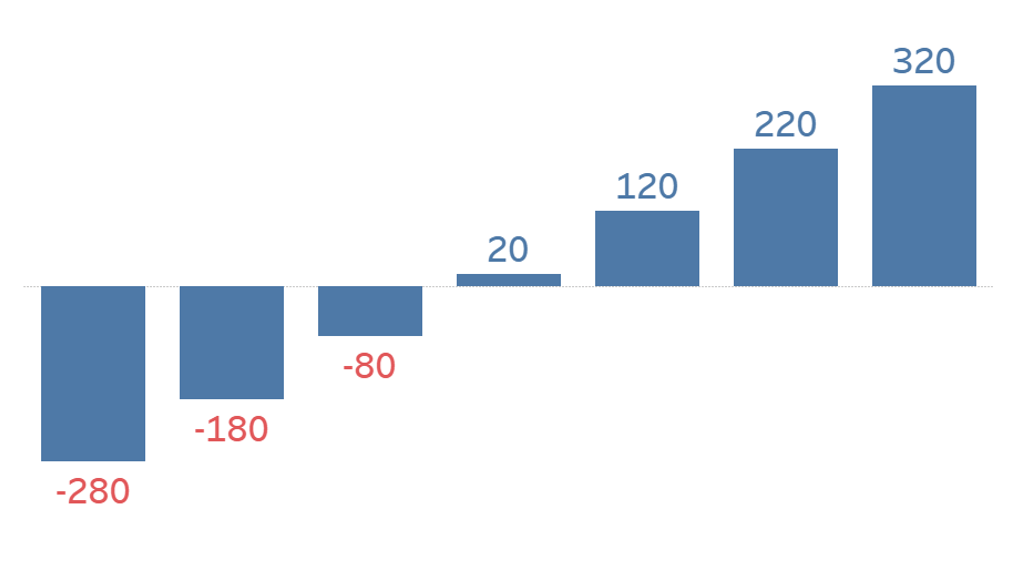
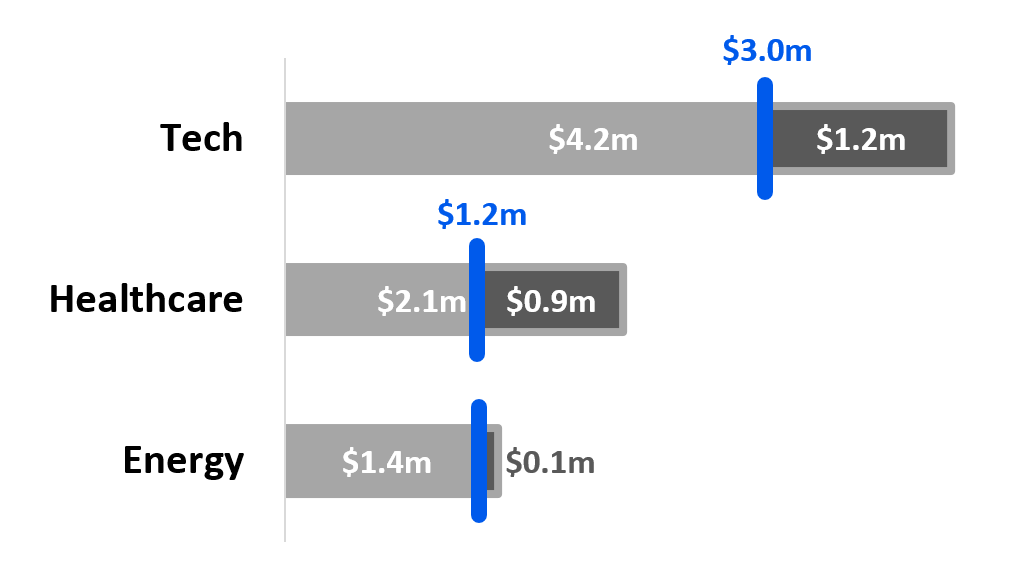
Critique Then Re-create
Re-creating a chart which shows progress against targets
#SWDchallenge
#Excel
««
«
1
2
3
»
»»