How to highlight an entire row in a Tableau table
Highlighting an entire table row in Tableau can help users keep track of what they’re looking at as they scroll horizontally.
Porblem: It’s difficult to keep track of a single row when scrolling across a wide Tableau table
Solution: Highlight the entire row a user clicks on
The highlight should span the entire table, including the row header dimensions on the left, and the measure values on the right:
Click here for the Tableau workbook
How does this work?
Getting this to work involves using Tableau’s Row Banding formatting. In a normal Tableau table, we automatically get these bandings - see the alternating grey rows below.
We can use this functionality along with a parameter action to highlight a single row when a user clicks on it.
Here’s a step-by-step guide on how to achieve this.
Step 1Create a new parameter
This parameter will be used to control which row is highlighted. You need to assign it values up to the maximum number of rows you have in your table. For example, if your table has up to 1,000 rows, then the parameter should have values 0 to 1,000.
Note that a parameter value of zero indicates that no row is highlighted, while when it’s set to 10 for example, the 10th row will be highlighted. But more on this later.
Create your new Highlight Row Number parameter as follows:
Luckily you can now paste values from Excel, otherwise you’d be typing for a while!
Now click on Show Parameter on your table’s sheet so that you can see its current value:
You’ll now see the parameter box on the right hand side of your sheet:
Step 2Create an INDEX() table calculation
This will be used to change the value of the parameter from Step 1 to the value of the row number the user clicks on in the table.
Create the Row Number calculated field:
❓ Did you know?
The INDEX() function is a useful table calculation which returns the row number when added to a table
Now convert the Row Number table calculation to discrete, so that Tableau doesn’t give you an axis when you add it to the table.
Next, add the Row Number calculated field to the Rows shelf. You’ll see that it gives you the current row number. This will be used to drive the parameter action when a user clicks on a specific row.
If at this stage you don’t see the correct row numbers, you can go to Edit Table Calculation and make sure it’s computed using Table (down) mode.
Step 3Create a calculated field for the row banding
Create a Row Banding calculated field:
Add the Row Banding calculated field to the Rows shelf on the left side, before any other fields:
Again, make sure this is calculated using Table (down) as in step 2.
Thanks to Data Plus Science for the inspiration for this formula. One improvement made here is that we use the INDEX() table calculation instead of a Row ID field from the data itself.
The benefit of this is that the data in the table can be sorted by any dimension and it still works. This is because INDEX() is a table calculation which will always give the correct row number, regardless of the table sort order.
Step 4Add Row Banding highlight colour
Next, if you change the value of the Highlight Row Number parameter you’ll see what’s going on with the new Row Banding calculated field added in Step 3:
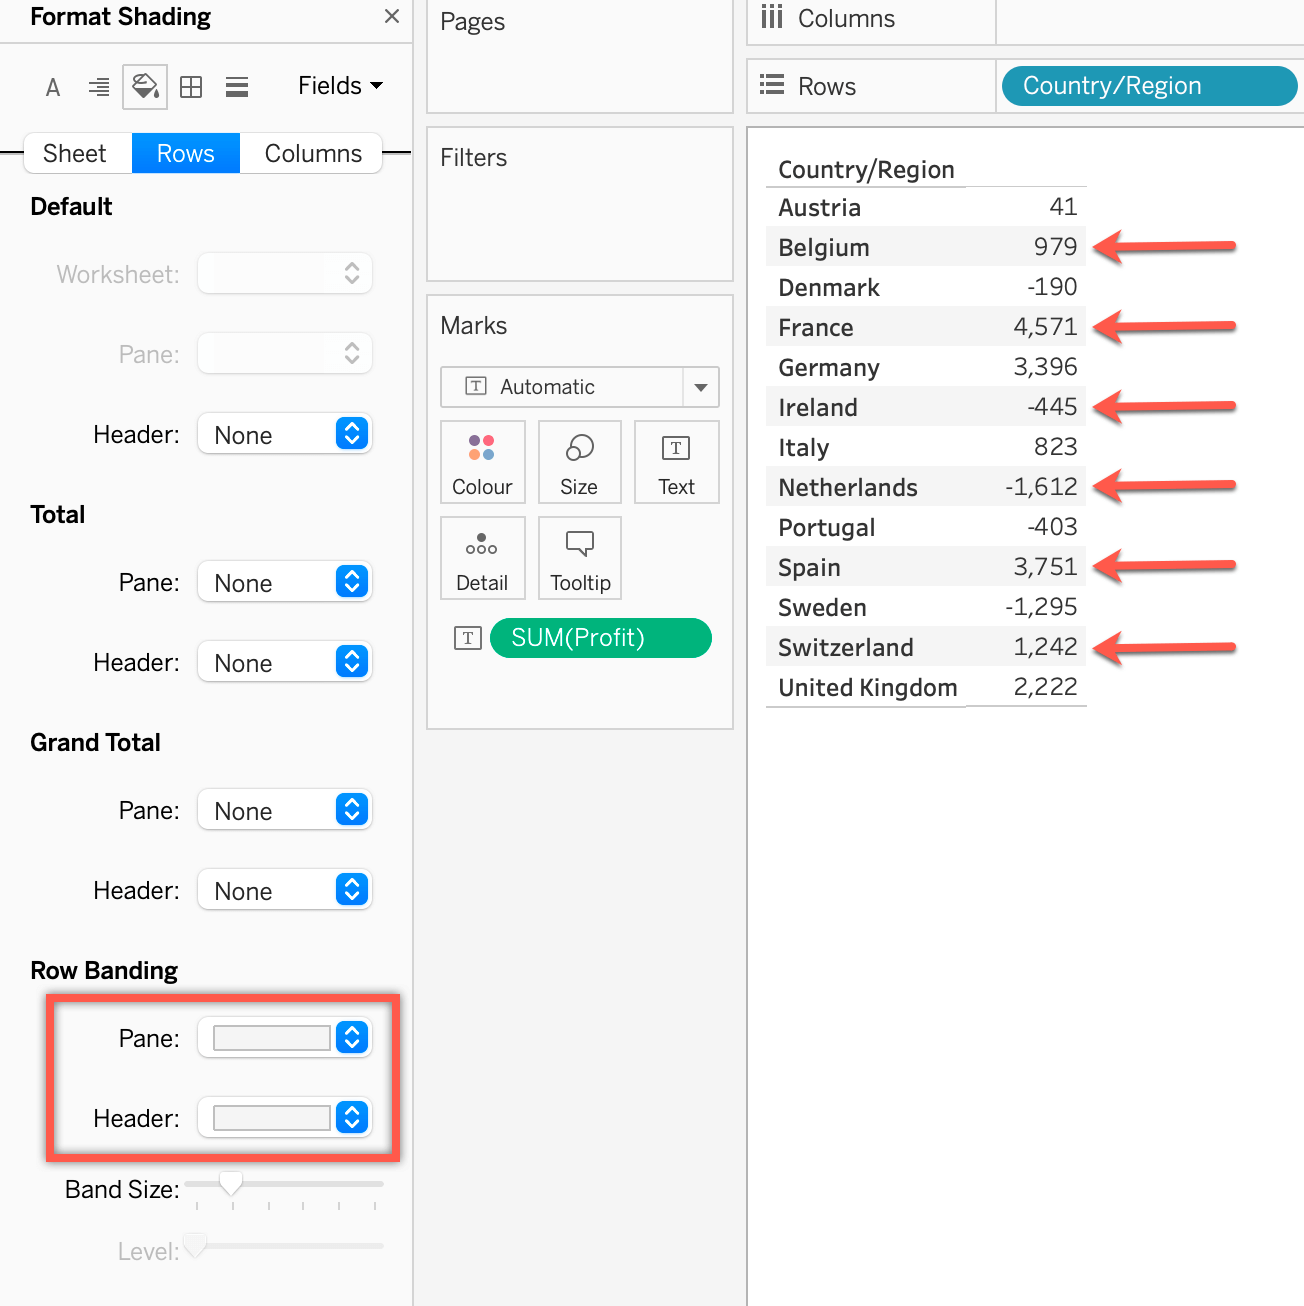
Now let’s move on to formatting the row bands. Click on Format then Shading:
Now, select the colour you’d like to use for the highlight and apply it to both the Pane and Header Row Banding. Make sure Band Size is set to position one to make sure only the second row banding category is highlighted. And set Level to position zero to make sure the highlight spans the entire table.
Step 5Hide headers for both Row Banding and Row Number calculated fields
Step 6Add a Dashboard Action
Once you have your sheet in a dashboard, use a dashboard action to change the value of the Highlight Row Number parameter when the table is clicked:
Add a Change Parameter action:
Set up the Parameter Action as follows:
Now you can click anywhere on the table and the entire row will highlight:
Known limitation: Due to the way row banding formats work, it’s not possible to highlight the top row of the table. I’m comfortable with this as it’s already easy to keep track of the top row as you scroll from side to side.
To make sure users can’t click on the top row, you can add a floating transparent Blank object over the first row: